
We see a tremendous amount of wasted effort on inventory optimization at companies. It’s not unusual to see efforts repeatedly diverted from one inventory effort (“Improve forecast accuracy!”) to another (“Implement ABC analysis!”) and on and on. Unfortunately, many managers do not have a comprehensive picture of the mechanics of inventory optimization. So what is inventory optimization?
Inventory optimization is represented graphically for a set of parts by efficient frontier curves on a tradeoff plot:
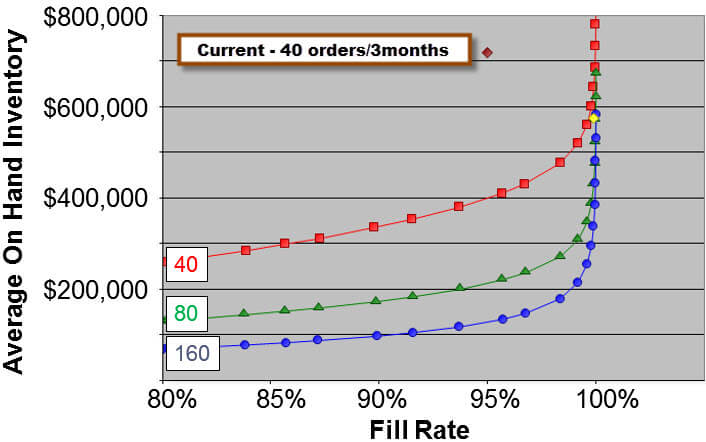
Each curve represents a different reorder frequency, could be for one part or a group of 100 parts. Any point on any curve is an optimal solution and provides the policies of when to order and how much to order for the parts in the analysis. As described in our previous blog, the perfect world for inventory is zero on-hand and 100% fill rate but variability always pushes the efficient frontier curve away from that point on the tradeoff plot.
Which curve and where on the curve a company wants to operate is a strategic decision made by management. The great advantage to this approach is it provides a visual evaluation, it is objective and it is completely understandable.
Does optimal inventory require minimum order quantities? Not necessarily and it turns out that large orders sizes sometimes work as well as small order sizes. This is good news because companies typically prefer fewer purchase orders (for raw material) or fewer setups (for finished goods). For instance on the plot above, about $400,000 in inventory with nearly 100% fill rate can be had with 80 orders/quarter (green curve) or 160 orders/quarter (blue curve). Most companies, if they want 400,000 dollars in inventory at 100 percent fill rate, would take the 80 orders/quarter policy. Doing so will result in order sizes twice as large as the 160 orders/quarter policy.
Since safety stock levels and reorder sizes are interdependent, the two points discussed above will have different safety stock levels but the average on-hand inventory will be the same ($400,000). Safety stock vs. average on-hand inventory is a common point of confusion for managers. Financial reporting ties to average on-hand inventory not safety stock. Minimal on-hand inventory with best desired fill rate is the goal of inventory optimization—not minimum safety stock.
ABC analysis is often a source of poor inventory policy. A part that has demand of 1000 pieces per month and cost of 1 dollar will have the same demand value, 1000 x 1, as a part that has a demand of 1 piece per month and a cost of 1000 dollars, 1 x 1000. Using demand value ABC, these two parts will be in the same policy group which is a huge mistake. Another caution against ABC is that it was originally invented before the advent of the computer as a way to handle the complexity inherent in managing many part numbers. With today’s computing power, ABC inventory analysis is like using a telephone booth phone to make all your phone calls. The fact that major software vendors sell ABC inventory modules speaks to their willingness to sell whatever a company will buy whether or not it is what the company needs—no surprise. That being said, there is certainly value in dividing parts into different categories for strategically managing inventory. Setting optimal performance for each individual part in a group should determine optimal policy. For instance, set critical parts to a fill rate of 95% or better—this will determine policies (safety stock and reorder quantities) for each individual part depending on each part’s demand and replenishment time profile.
Your current ERP system can be used to ensure that when you select a point on a curve, the optimal policies you select are actually being used and will provide the results you expect. Imagine that, using your ERP system as a real control system rather than merely as a transaction tracking system. It’s not unusual for planners to look only at what they have on-hand when determining the “health” of a part’s inventory levels. This is a serious mistake. Without including on-hand, on-order and backorders in the picture, there is very little chance that a planner will exert predictable control over part performance. A little known technique is to monitor the inventory position of a part to ensure it is always between upper and lower control limits. The control limits take in to account variability in demand and replenishment time. A part outside of its control limits is a signal that action needs to be taken. Only the parts that are outside of their control limits need action. This is management by exception and greatly eases the mechanics of managing hundreds or even thousands of parts. It’s all part of true inventory optimization.
 Ed Pound is Chief Operations Officer of Factory Physics Inc. Ed has worked with major international companies such as Intel, 3M, Baxter Healthcare and Whirlpool providing education and consulting in the practical operations science of Factory Physics concepts. Ed’s work has helped companies realize millions of dollars in improvements and make operations, supply chain management and product development easier. Ed is lead author, along with Dr. Mark Spearman and Jeff Bell, of McGraw-Hill’s lead business title Factory Physics for Managers.